| OPTA Stats 12:52 - Oct 11 with 1821 views | heavyweight |
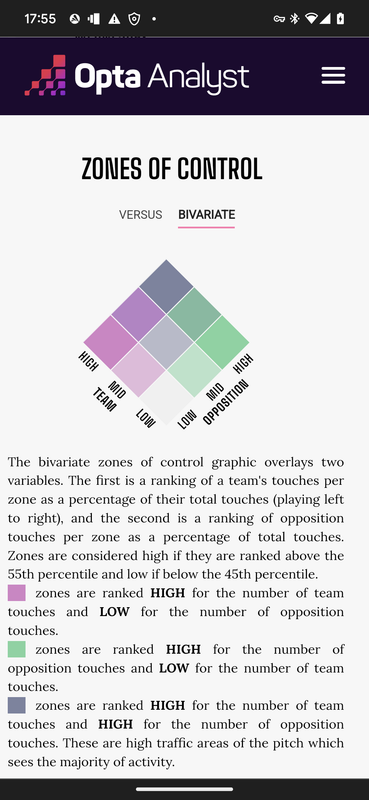
Can someone clever please make sense of the "zones of control" diagrams on this page. I watched most of the games this season and although we haven't dominated possession like last year - I would have thought our pictorial looks better than they've displayed.
My only explanation is that we tend to pin back the opposition in their half and when we have possession in the oppositions half we don't pfaff about with it too long before there is an attempt on goal. Both these things mean the opposition is likely to have more possession in their half than us.
https://theanalyst.com/eu/2023 [Post edited 11 Oct 2023 13:04]
|  | | |  |
| OPTA Stats on 12:57 - Oct 11 with 1768 views | bluestandard |
That’s so weird, I was struggling to make sense of that too the other day! I came to the same conclusion that we work the all through the phases of the pitch so quickly that in pure time terms, the opposition have more of the ball than us in their half. | | | |
| OPTA Stats on 15:05 - Oct 11 with 1591 views | Vegtablue |
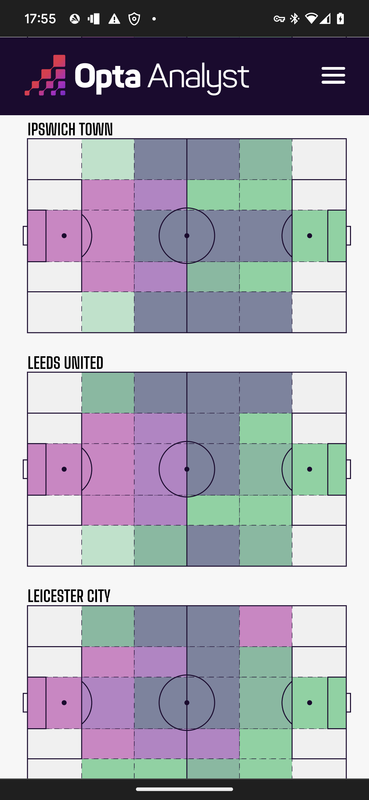
Yes it speaks to the quality of the league. Last season, we averaged over 60% possession and every rectangle was blue outside the opposition penalty area. Opta had to make the 'Team Style Comparison' graph twice as wide to fit us in. We were comparatively slow and very intricate last season, similar to where Leicester are displayed now but with nobody in the second half of the graph. In reality our style hasn't changed: the opponent is dramatically different and our numbers are very different as a consequence. We used to make hundreds more passes in the opponents' half because we started so far upfield and there was so little space to progress into.
This season our possession is 50.2%, which lends itself to an even split of the 'zones of control'. We have 10 zones and the average opponent has 14 because our play in the channels and opposition half is so quick. You will rarely see Leif or Brandon take multiple touches, and when they do it's normally because they are driving forwards with it. Contrast this with slower tempo opponents and the end result is that graphic you found, which to untrained eyes suggests our left back is a problem rather than an asset. We also attempt to 'take on' opposition players less than most in the league, which again speaks to our preference for 'pass and move quickly forwards'.
It's the reason I'm mindful of the attritional nature of this league, to be honest. It's less physically demanding to dominate the ball, pitch and chances than it is to only dominate the chances. If we maintain our energy levels I'm confident we'll continue to do the latter, which is what truly counts and the reason we're second, but if we need to slow down at some point then we are untested playing that way. It could result in an increase in possession and pitch dominance and only a modest decrease in chances created, or it could result in a much more even split of chances than currently enjoyed now. | | | |
| OPTA Stats on 15:48 - Oct 11 with 1534 views | BlueBoots |
You've pretty much got that spot on; once we get the ball forward we very rarely look to pass backwards, recycle possession and change the focal point of an attack (clearly something that Leicester do by the look of their diagram) That can work for or against you - creating chances quickly gives the opposition less chance to regain their defensive shape, but does mean we're risking a few half-chances rather than patiently waiting for an opening (although we get so many players forward to support attacks, if we do allow other teams the time to regroup we leave ourselves open to counter-attacks)
Can see from the diagram that we dominate the central areas in our half through Morsy and Luongo controlling those zones (both in and out of possession), plus any high balls are usually dealt with easily by Burgess and returned to the opposition half. The zones of control down the wings show how much Davis gets forward (and our left-sided AM, usually Broadhead, tucks in), and we're stronger defensively down the right with Burns (or his replacement) holding the width, and offensively with our right-back getting forward to create overloads (pretty much what we were doing last season) |  |
| |
| OPTA Stats on 18:03 - Oct 11 with 1372 views | heavyweight |
| OPTA Stats on 17:58 - Oct 11 by Vegtablue |
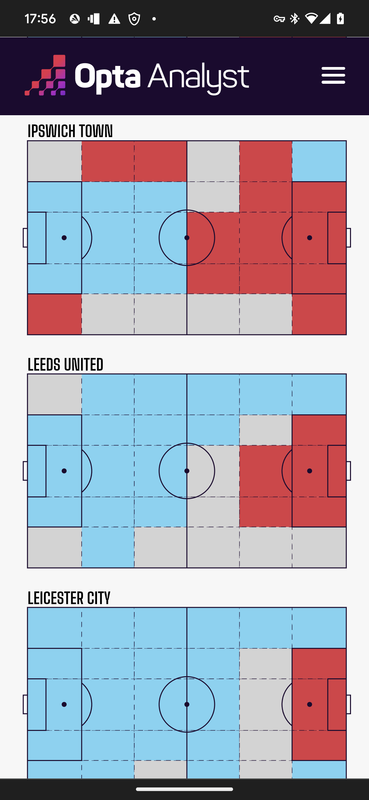
Good analysis all. Did anyone check out the bivariate graphic? Pasted below for anyone interested.
And for anyone interested who didn't click the OP's link: blue rectangles show that the home team gained over 55% of touches in the covered area, red rectangles show that the away team did.
 |
Thanks for the good analysis chaps, it shows these things can't really be taken at face value. | | | |
| |