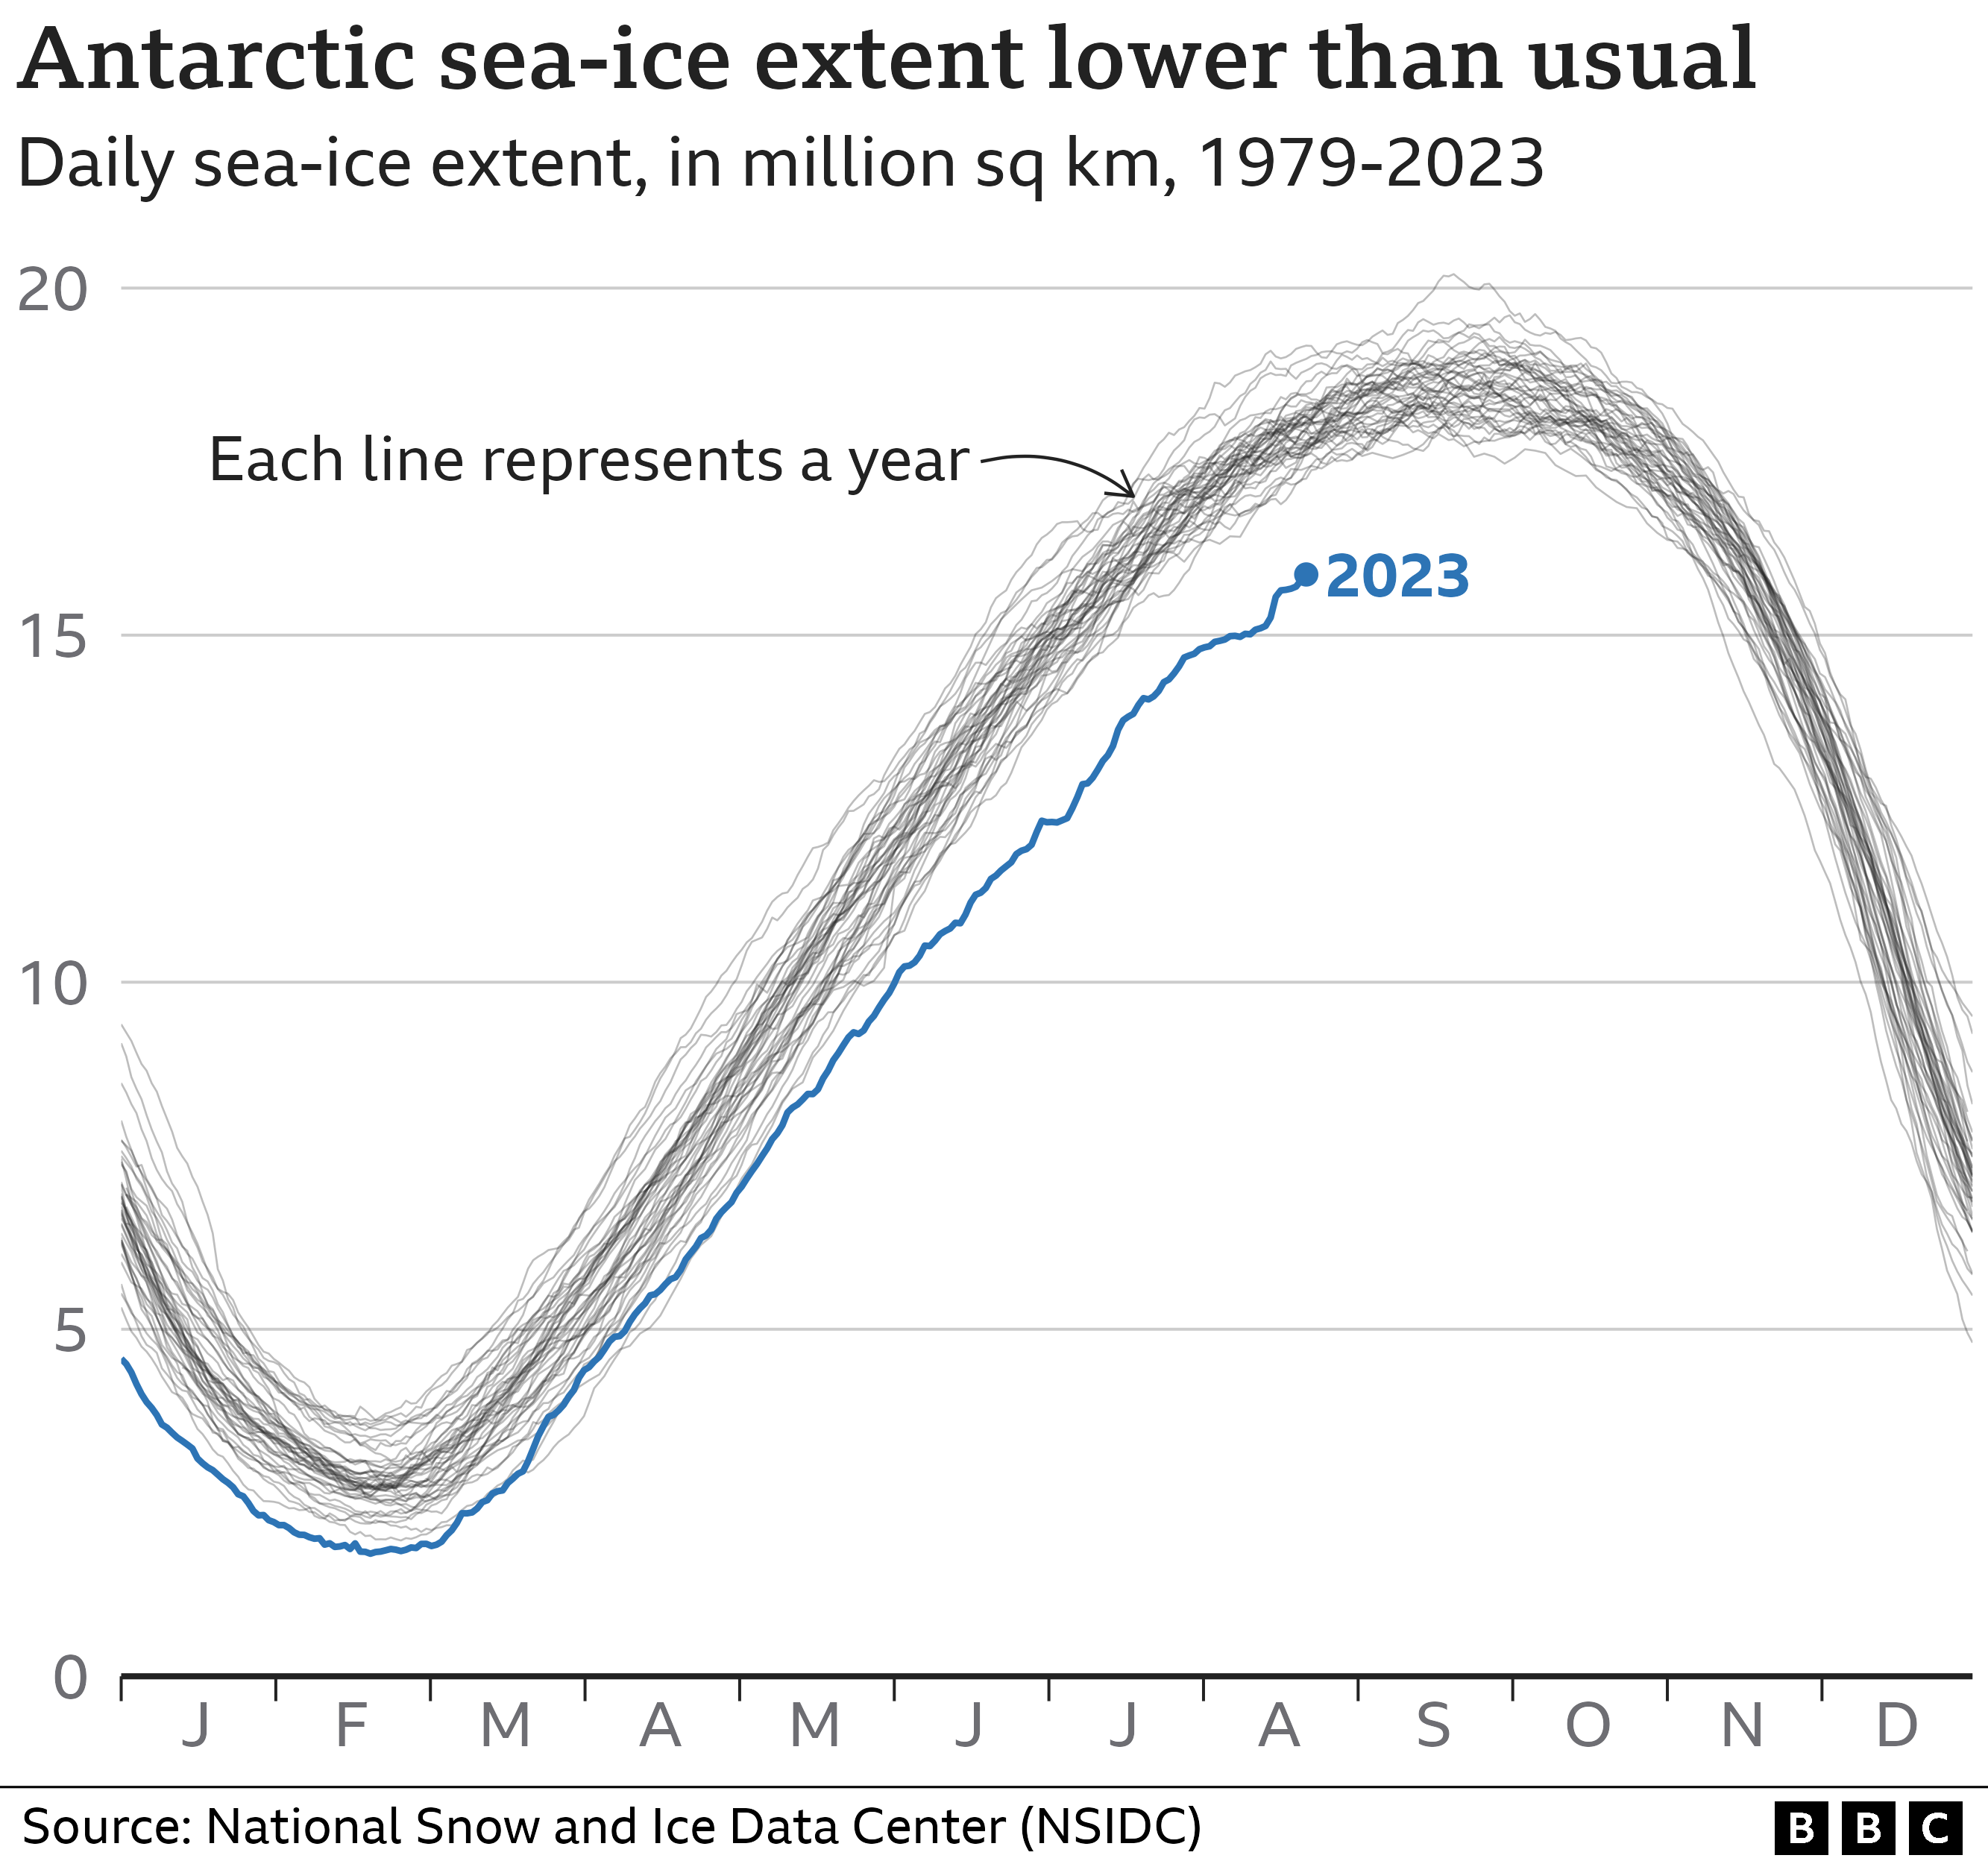
| Here's another one of those startling 2023 outlier graphs. 19:17 - Aug 24 with 5510 views | NthQldITFC |
.. which few of us seem to want to face up to and talk about.
Is it an indicator of something snowballing and being too far gone for us to do anything about, or is there some motivation to try to reduce the impact of Anthropogenic Global Heating?
Same old question. Why are we not trying to save our children's futures? Why are we bullsh!tting and pissing about? Are we just too chicken to face the truth? |  |
| |  |
| Here's another one of those startling 2023 outlier graphs. on 10:06 - Aug 25 with 909 views | jayessess |
| Here's another one of those startling 2023 outlier graphs. on 23:31 - Aug 24 by BondiBlue |
Maybe people don't want to have to spend the time that they're not working, parenting or worrying about the cost-of-living crisis/nuclear war worrying about an impending climate meltdown.
Our leaders should be doing much more but i can't blame your average joe public from wanting to ignore this. At the end of the day, what more can you or me do about it? I drive a hybrid, i recycle and i vote for political parties that are pro-climate change action. When i own a house, i will install solar and, if i can afford it, my next car will be an EV. Beyond that, there is nothing more i can do. |
Trouble is, the policies and priorities of governments are massively shaped by the needs and preferences of big capital. Whilst you get to express a preference on what kind of government you want once every five years, with climate change mixed in as one issue amongst all the other things that you worry about, the fossil fuel industries, the automotive firms, the retail sector, the energy firms, all those guys get fairly constant access to our politicians, as well as having control of huge flows of capital which determine economic outlooks for whole countries and regions. All while the debate about climate change is shaped by their natural allies in the media (other representative of big capital).
All of that makes it incumbent on ordinary citizens to actively organise politically to make immediate and drastic action a priority, otherwise the mechanics of global political economy mean it almost certainly won't be. [Post edited 25 Aug 2023 13:33]
|  |
| |
| Here's another one of those startling 2023 outlier graphs. on 13:32 - Aug 25 with 865 views | HotShotHamish |
There was a climate scientist on R4 yesterday talking about the penguin story that is currently in the news. When questioned on this very subject he explained that this years events could well be more down to the El Nino effect than climate change.
Before I get jumped on this does not mean I do not believe in climate change or that I am denying it is happening but you do really have to look at all possible causes before jumpoing to a conclusion that you are not qualigfied to give.
Just look at the graph you posted - apart from this current year what is does show is there has been little change in the Antartctic sea-ice in the last 44 years, |  | | |
| Here's another one of those startling 2023 outlier graphs. on 13:51 - Aug 25 with 817 views | jayessess |
| Here's another one of those startling 2023 outlier graphs. on 13:32 - Aug 25 by HotShotHamish |
There was a climate scientist on R4 yesterday talking about the penguin story that is currently in the news. When questioned on this very subject he explained that this years events could well be more down to the El Nino effect than climate change.
Before I get jumped on this does not mean I do not believe in climate change or that I am denying it is happening but you do really have to look at all possible causes before jumpoing to a conclusion that you are not qualigfied to give.
Just look at the graph you posted - apart from this current year what is does show is there has been little change in the Antartctic sea-ice in the last 44 years, |
There's an el nino every 2 to 7 years, but you don't see them on this graph though... | |
| |
| Here's another one of those startling 2023 outlier graphs. on 13:58 - Aug 25 with 814 views | NthQldITFC |
| Here's another one of those startling 2023 outlier graphs. on 13:32 - Aug 25 by HotShotHamish |
There was a climate scientist on R4 yesterday talking about the penguin story that is currently in the news. When questioned on this very subject he explained that this years events could well be more down to the El Nino effect than climate change.
Before I get jumped on this does not mean I do not believe in climate change or that I am denying it is happening but you do really have to look at all possible causes before jumpoing to a conclusion that you are not qualigfied to give.
Just look at the graph you posted - apart from this current year what is does show is there has been little change in the Antartctic sea-ice in the last 44 years, |
You're right to question whether El Nino has something to do with it, but remember El Nino is a natural fluctuation which occurs every four years or so (I think that's about right). We're only just entering an El Nino phase at the moment too I think.
As to your interpretation of the graph, you're badly out there I'm afraid. The band of plots represent a distribution of forty years of variable sea ice, which may or may not have a trend within it - you can't tell because none of the plots except 2023 are labelled. It's a distribution. There's one massive outlier year (this year).
Firstly, this year being so far away from the rest doesn't 'show' that the rest are in a tight band of 'little change' - that's just stupid.
Secondly, we know of a number of significant mechanisms which can affect global and local parts of the system. These mechanisms can and are predicted to start causing serious yet localised events like this as climate change progresses. One particular worry is that something statistically extraordinary like this represents a cascading series of cross-triggering events.
We won't 'know' until it's far too late. | |
| |
| Here's another one of those startling 2023 outlier graphs. on 14:08 - Aug 25 with 790 views | HotShotHamish |
| Here's another one of those startling 2023 outlier graphs. on 13:51 - Aug 25 by jayessess |
There's an el nino every 2 to 7 years, but you don't see them on this graph though... |
I was quoting a well-renowned climate scientist. I am sure he knows more on the subject than either of us!
He did go into further detail on how the El Nino was affecting the sea temperatures but it was way above my head. | | | |
| Here's another one of those startling 2023 outlier graphs. on 14:21 - Aug 25 with 763 views | jayessess |
| Here's another one of those startling 2023 outlier graphs. on 14:08 - Aug 25 by HotShotHamish |
I was quoting a well-renowned climate scientist. I am sure he knows more on the subject than either of us!
He did go into further detail on how the El Nino was affecting the sea temperatures but it was way above my head. |
El Nino describes the warm phase of natural temperature oscillations in the Pacific Ocean: https://education.nationalgeog
What the climate scientist will have been describing is why this year's temperatures are so different from last year's, not why they're historically an outlier. | |
| |
| Here's another one of those startling 2023 outlier graphs. on 14:41 - Aug 25 with 744 views | CoachRob |
| Here's another one of those startling 2023 outlier graphs. on 13:32 - Aug 25 by HotShotHamish |
There was a climate scientist on R4 yesterday talking about the penguin story that is currently in the news. When questioned on this very subject he explained that this years events could well be more down to the El Nino effect than climate change.
Before I get jumped on this does not mean I do not believe in climate change or that I am denying it is happening but you do really have to look at all possible causes before jumpoing to a conclusion that you are not qualigfied to give.
Just look at the graph you posted - apart from this current year what is does show is there has been little change in the Antartctic sea-ice in the last 44 years, |
You could've just read the abstract of the paper that researched penguin colonies.
https://www.nature.com/article
Who was the scientist? |  | | |
| Here's another one of those startling 2023 outlier graphs. on 14:50 - Aug 25 with 738 views | Swansea_Blue |
| Here's another one of those startling 2023 outlier graphs. on 13:51 - Aug 25 by jayessess |
There's an el nino every 2 to 7 years, but you don't see them on this graph though... |
They're also not an event of a fixed magnitude. Increased warming is predicted to impact the intensity of El Niño events. So even if this year's El Niño is having a big impact on what's happening this year, we could be seeing a stronger than usual one due to the increased warming.
It's a worrying year for sure. It'll be interesting to see what happens over the next 3-5 years or so (ideally through to the next El Niño event). Is this year going to be a one-off outlier or are we seeing a step change into a 'new normal' (for want of a better term...)? |  |
| |
Login to get fewer ads
| Here's another one of those startling 2023 outlier graphs. on 15:01 - Aug 25 with 733 views | StokieBlue |
| Here's another one of those startling 2023 outlier graphs. on 14:08 - Aug 25 by HotShotHamish |
I was quoting a well-renowned climate scientist. I am sure he knows more on the subject than either of us!
He did go into further detail on how the El Nino was affecting the sea temperatures but it was way above my head. |
Who was the scientist?
While El Nino does affect surface temperatures, the loss of sea ice shows a clear trend over many years.
SB |  | | |
| Here's another one of those startling 2023 outlier graphs. on 15:04 - Aug 25 with 708 views | StokieBlue |
Given the record high sea surface temperatures this year here are another couple of images for you:
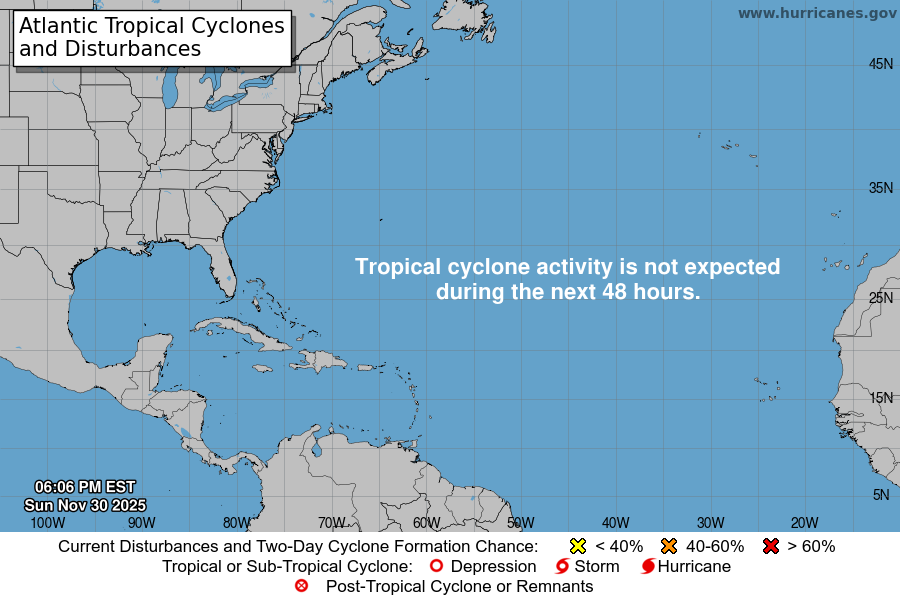
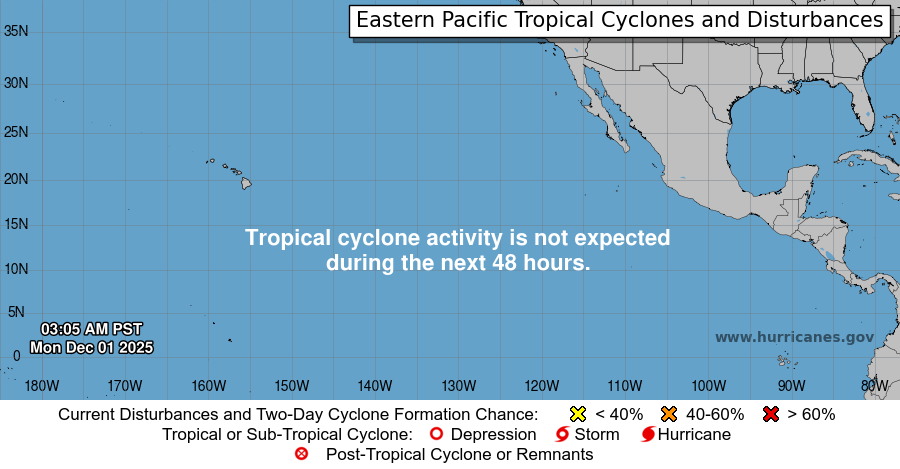
Could conceivably be a horrible year for hurricanes, hopefully not but it'll become clear over the next 2 months. That is however a lot of storms with the possibility of becoming serious storms all circulating at the same time.
SB | | | |
| |