 Championship – Half-Term Report Championship – Half-Term ReportWritten by realprojection on Monday, 28th Dec 2015 13:00 What with Christmas and Sky Sports' scheduling it’s difficult to keep up with the Championship at the moment, but a quick glance at the table shows 23 games played - the halfway point. Actually, at time of writing, Forest and Leeds still have an outstanding match in the 23rd round of fixtures. But the postponement of Boro’s game at Blackburn, a casualty of unyielding northern rain, means we won’t get a perfect midpoint anyway. So we’re pretty much at halfway, which is usually a good time to take stock of where things are. In my half-term report I use my 'adjusted goals' rating measure to assess teams’ performance. This isn’t anything too complicated – it simply uses a combination of goals, shots on target and shots to rate each team’s attack and defence. The formula is: Adjusted goals = 45.0%*Goals + 8.4%*â€Shots on target†+ 2.8%*Shots. I’ve found this measure predicts future performance better than goals scored or conceded, or points attained (although in the Championship no measure is particularly good at predicting future performance). If you’re interested I’ve explained the rationale for this measure in my blog here. So here’s the report:
Best Attack – Hull CityThis is a bit of an odd one. Surprisingly Fulham (currently in 18th position) have scored the most goals (36). But Hull have managed the most shots on target at an average of nearly five per match. This gives them the highest attack rating of 1.55 adjusted goals per match.
Worst Attack – Preston North EndThis one’s shaded by Preston, equal lowest goal scorers with Bolton, but poorest by virtue of fewer shots on target and an attack rating of only 0.99 adjusted goals per match.
Best Defence – Derby CountyJust pipping Middlesbrough by conceding just three shots on target on average per game.
Worst Defence – Charlton AthleticAnother strange one. Fulham, as well as highest scorers, have also conceded most goals. But Charlton’s shots conceded total makes them worst.
Best Team – Derby CountyThis is based on adjusted goal difference. On this measure Derby, Middlesbrough and Hull are way ahead of the rest. And out of these three Derby win out, just.
Worst team – Charlton AthleticLooking at the league table it’s surprising it’s not Bolton – but on underlying goals and shots Charlton are worst. The full numbers are as follows (all figures are average per match):
Luckiest team – Brighton and Hove AlbionThis one’s a bit tenuous, but I use the adjusted goals measure to work out what points a team would normally get for a given rating. Based on this Brighton have got nearly seven points more than expected. This might be luck – or just great finishing and defending.
Unluckiest Team – ReadingBased on the same measure Reading would expect nearly 11 more points than they’ve got. The full numbers are as follows:
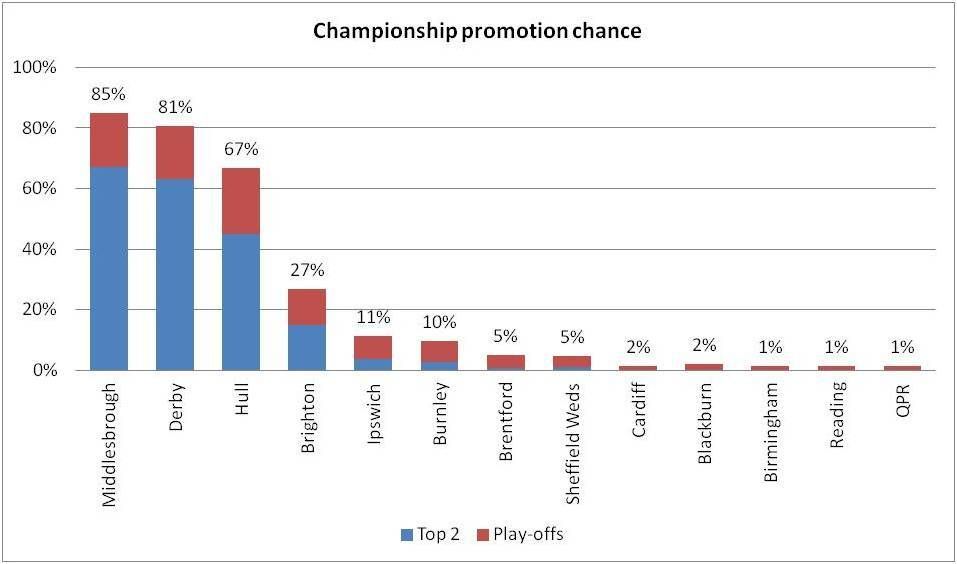
Team most likely to get promoted - MiddlesbroughFor this I use a long-term adjusted goals rating, which takes account of last season’s form too (which is why Boro are ahead). The model carries out 5000 simulations of potential scenarios from the current point in the season. Boro are top but Derby and Hull are close behind.
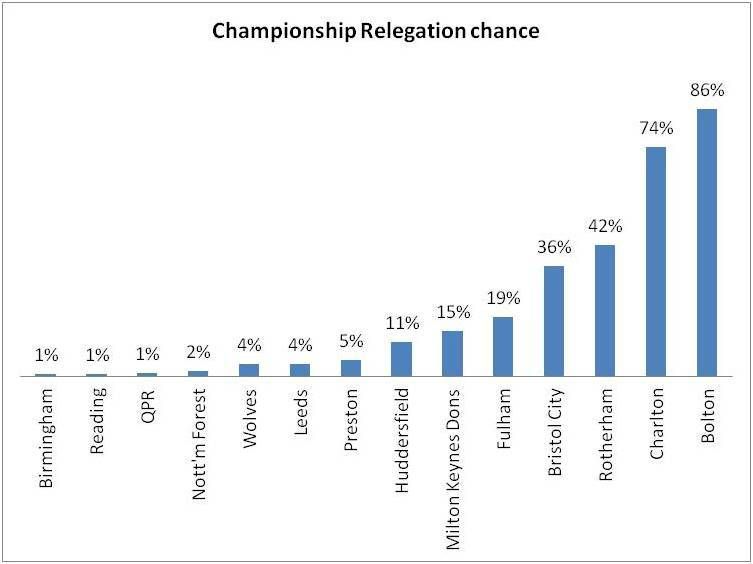
Team most likely to get relegated – BoltonNot surprisingly Bolton are the most likely team.
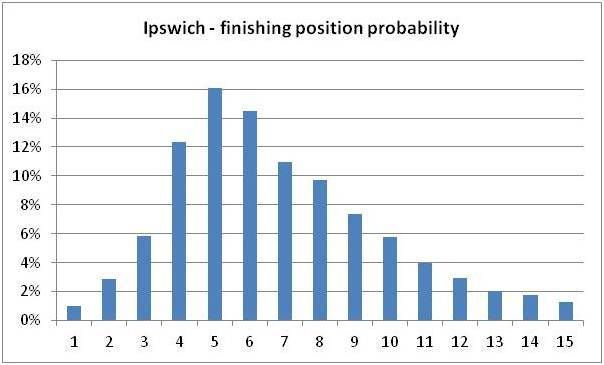
 But to show how volatile things can be in the Championship – Ipswich could finish up pretty much anywhere.
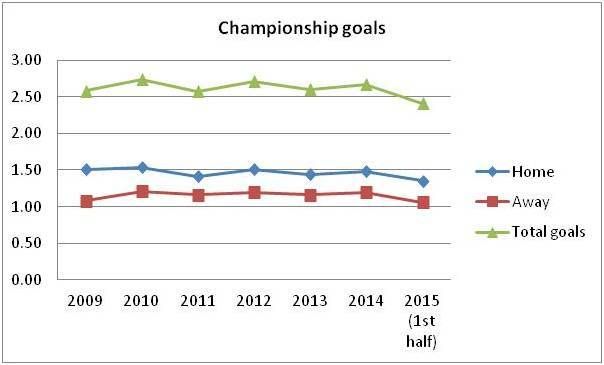
Goal ScoringHalfway through the season goal scoring is low (apart from Fulham matches!) with an average of 2.41 per match, which is lower than all of the past six seasons. Home advantage has remained steady at around 0.29 additional goals per game.
 Please report offensive, libellous or inappropriate posts by using the links provided.
|
Blogs by realprojectionBlogs 297 bloggers | ||||||||||||||||||||||||||||||||||||||||||||||||||||||||||||||||||||||||||||||||||||||||||||||||||||||||||||||||||||||||||||||||||||||||||||||||||||||||||||||||||||||||||||||||||||||||||||||||||||||||||||||||||||||||||||||||
We in turn value your personal details in accordance with our Privacy Policy.